Spectrum and Spectral Response Curve

Spectrum
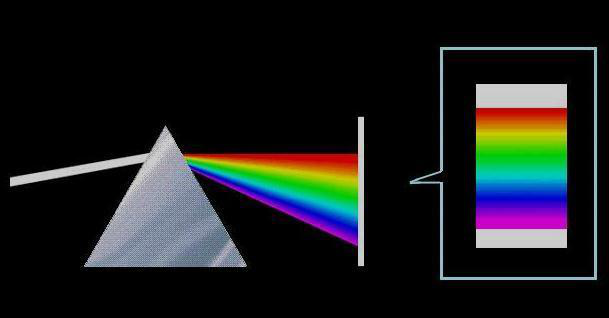
A spectrum is the pattern formed by dispersing multicolored light through a dispersive system (such as a prism or diffraction grating), with monochromatic light arranged in sequence according to wavelength (or frequency). The largest part of the spectrum, the visible spectrum, is the part of the electromagnetic spectrum visible to the human eye. It does not encompass all colors distinguishable by the human brain, such as brown and pink.
Light waves are electromagnetic radiation produced by the movement of electrons during atomic processes. Different substances have different internal electron movement, resulting in different emitted light waves. The study of the emission and absorption of light by various substances, known as spectroscopy, has significant theoretical and practical implications and has become a specialized field. Infrared absorption spectra of molecules are generally studied in terms of vibrational and rotational spectroscopy, with vibrational spectroscopy being a major research topic.
Principle
In polychromatic light, there are various light waves with different wavelengths (or frequencies), each having different refractive indices in a medium. Therefore, when polychromatic light passes through a medium with a certain geometric shape (such as a prism), light of different wavelengths undergoes dispersion at different exit angles, resulting in a phenomenon known as dispersion, projecting continuous or discontinuous colored bands. This principle is also applied in the famous experiment of solar light dispersion. Sunlight appears white, but when it passes through a prism, it forms a continuous spectrum of colored light arranged in the order of red, orange, yellow, green, blue, indigo, and violet, covering the visible light range from approximately 390 to 770 nanometers. This experiment was first conducted by the British scientist Sir Isaac Newton in 1665, providing the first objective and quantitative characteristics of light.
Classification
By Wavelength Region
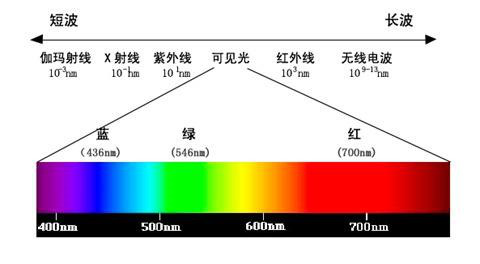
Outside the red end of some visible spectra, there are longer-wavelength infrared rays, and outside the violet end, there are shorter-wavelength ultraviolet rays. Infrared and ultraviolet rays are not detectable by the human eye but can be recorded by instruments. Therefore, in addition to the visible spectrum, the spectrum also includes infrared spectra and ultraviolet spectra.
By Generation Method
By generation method, spectra can be divided into emission spectra, absorption spectra, and scattering spectra.
Some objects can emit light by themselves, and the spectra formed by the light they generate are called emission spectra.
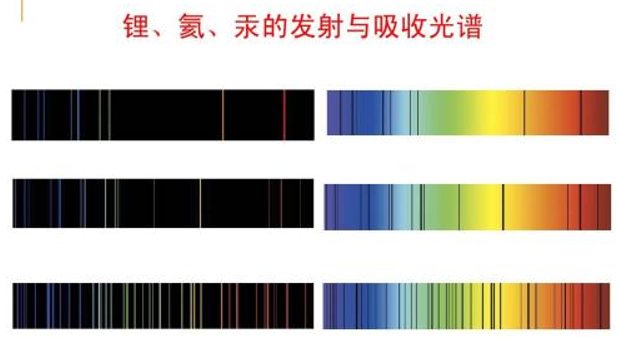
Emission spectra can be divided into three different types: line spectra, band spectra, and continuous spectra. Line spectra are mainly produced by atoms and consist of discontinuous bright lines; band spectra are mainly produced by molecules and consist of dense light within a certain wavelength range; continuous spectra are mainly produced by incandescent solids, liquids, or high-pressure gases stimulated to emit electromagnetic radiation, consisting of continuous distribution of all wavelengths of light.
When white light passes through a gas, the gas absorbs light of the same wavelength as its characteristic spectral lines from the passing white light, resulting in dark lines in the continuous spectrum. At this time, the spectrum of light absorbed by the substance to produce the continuous spectrum is called an absorption spectrum. Typically, fewer characteristic spectral lines are seen in absorption spectra than in line spectra.
When light shines on a substance, non-elastic scattering occurs. In addition to the elastic component (Rayleigh scattering) with the same frequency as the exciting light in the scattered light, there are components longer and shorter than the exciting light, collectively referred to as the Raman effect. This phenomenon, discovered by Indian scientist Raman in 1928, and the resulting spectrum of light is called Raman spectrum or Raman scattering spectrum.
By Generation Essence
By generation essence, spectra can be divided into molecular spectra and atomic spectra.
In molecules, the energy level of electronic states is 50 to 100 times higher than that of vibrational states, and the energy level of vibrational states is 50 to 100 times higher than that of rotational states. Therefore, transitions between electronic states of molecules are always accompanied by transitions between vibrational and rotational states, resulting in many spectral lines clustered together to form molecular spectra, also known as band spectra.
In atoms, when atoms are excited from the ground state to higher energy states in a certain way, the internal energy of the atom increases, and some electrons in the atom are excited to the excited state. However, excited states cannot be maintained, and after a short random time, the excited atoms return to their lower energy states. When electrons return to lower energy levels in atoms, they release a photon, i.e., this energy is emitted in the form of light, resulting in atomic emission spectra, also known as line spectra. Because the change in atomic energy states is discontinuous and quantum in nature, the resulting spectrum is composed of discontinuous bright lines, so atomic spectra are also called line spectra.
Spectral Response Curve
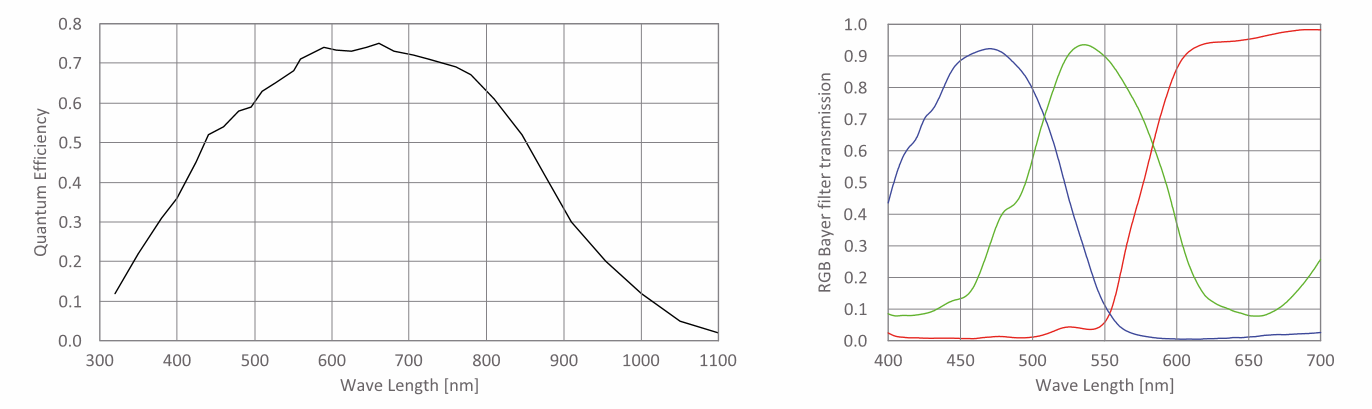
The spectral response curve refers to the relationship curve between the photocurrent and the wavelength (or frequency) of light. It reflects the degree of response of a photoelectric material to light of different wavelengths or frequencies. Generally, keeping the intensity of the incident light constant, measuring the photocurrent produced by light of different frequencies, and plotting the relationship curve between the photocurrent and the wavelength (or frequency) of light is the spectral response curve.
Different photoelectric cathodes have different spectral response curves. For a clean metal surface, its spectral response curve usually shows a monotonically increasing trend with increasing frequency of incident light, known as the normal photoelectric effect.
According to experimental results, when the frequency of incident light is slightly greater than the work function of the material, the frequency characteristic curve of the normal photoelectric effect approximately follows a formula. This formula indicates that the relationship between the photocurrent generated by a unit light flux and the frequency of light can be approximated by a parabolic shape near the frequency of the material.
For some materials, such as alkali metals and complex photoelectric cathodes, their spectral response curves are not monotonically increasing but exhibit peaks in photocurrent at certain frequencies, a phenomenon known as selective photoelectric effect.
The reason for the selective photoelectric effect is that within a certain frequency range, the number of free electrons excited above the vacuum level in the cathode decreases with increasing frequency. This phenomenon leads to a peak in photocurrent at a specific frequency.
In summary, the discovery and understanding of spectra have deepened our understanding of light and electromagnetic waves and provided theoretical support for the spectral characteristics of materials and the response characteristics of photoelectric materials in production and manufacturing, thereby promoting more precise detection and accurate identification in machine vision.
FALenses Technology specializes in providing machine vision core hardware. You can go to the official website of FALenses Technology at https://www.falenses.com/ for more information.